
Activities
Methane
Methane is a naturally occurring greenhouse gas whose concentration in the atmosphere is growing as a result of human activities, such as agriculture, waste disposal, and fossil fuel production and use. The mixing ratio of atmospheric CH4 varied between 350-750 ppbv from 110.000 to 300 years ago. Measurements of air in ice cores from the polar regions show that CH4 has more than doubled since pre-industrial times, and its global average atmospheric concentration is today above 1900 ppbv. The CH4 growth rate increased to a level of 14 ppbv/year by the 1970s and slowed significantly during the eighties. This decline in the CH4 growth rate is probably partly due to changes of emissions of some chemical compounds, such as CO and NO2, that affect OH, the primary sink for CH4. A reduced growth of CH4 sources also may be involved. The short lifetime of CH4, about 8 years, implies that a reduction of several percent in a major source could have caused the reduced CH4 growth rate.
The CH4 concentration at Lampedusa is determined by a FID-gaschromatograph.
The time series of methane measured in the period 1995-2019 is shown in Figure 1.
The average annual cycle, with a maximum in February, has an amplitude of about 27 ppbv. The growth rate (see figure 2) was close to zero during
1999 and 2000, and showed a positive peak in 1998. This peak is. believed to be related to enhanced emissions from wetlands at high northerly latitudes and from the
southern tropics, owing to unusual high temperatures. The growth rate displayed a negative minimum (-14 ppbv/year) in 2000 and reached positive values during 2001.
Like the CO2, also the CH4 growth rate (GR) appears to be related to El Niño/Southern Oscillation (ENSO) and to global average temperature.
The largest correlation (cross correlation coefficient of -0.87) between Southern Oscillation Index (SOI) and the CH4 growth rate is found for a time
lag of 10 months on SOI; the peak correlation between methane GR and global temperature anomaly (Tg), 0.92, occurs for a three month lag on Tg.
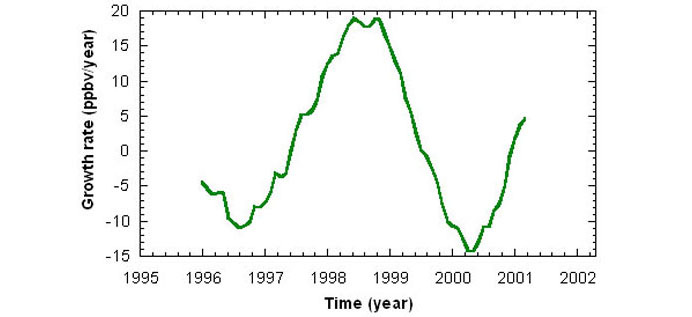
Figure 2. Yearly average growth rate of methane concentration vs. time
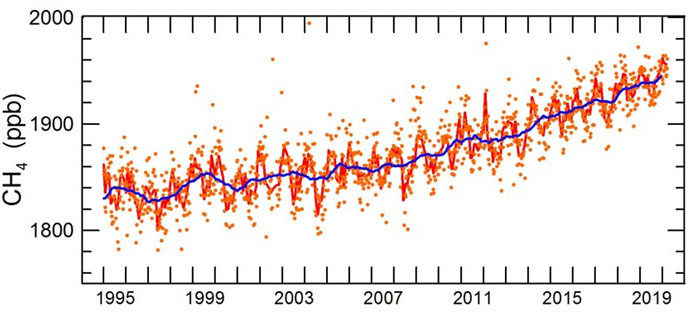
Figure 1: Time series of methane concentration in period 1995-2019time series of monthly mean CFC-11 concentrations